
Browse all guides
ADD TO YOUR WIDGET
Lists
Show several days, readings, events, or forecast hours together—each with its own details.
In this guide
What is a list?#
Suppose you want to see how much you walked on each of the last seven days. One step count cannot tell that whole story. A list can: it puts the days on your widget separately, with a step count beside each one.
| Day | Step count |
|---|---|
| Today | 6,410 |
| Yesterday | 7,730 |
| Sun | 4,981 |
Each entry is called a row. In this example, one row means one day. In an events list, one row means one event. You choose what details to put in an entry and how it looks; the app fills the entries with their own dates, names, and numbers.
You do not type out seven days or make seven separate text boxes. Design the first entry once, and the others follow the same design. That is what the app means by Your row.
What can you show?#
- Steps, day by day
- One entry for each day’s step count. Choose Last 7 days, This week, Last week, or This month. In List → Shows → Measurement, you can choose another supported daily Health measurement.
- Heart rate readings
- One entry for each recorded measurement, with its value and time. Last 24 hours means readings recorded in that period; it does not mean one reading every hour or continuous monitoring. Other supported measurements can be chosen under Measurement.
- Next hours or Next days
- One entry for each hour or day in the weather forecast. Use these for upcoming weather; they do not show yesterday’s weather history.
- Next events or Reminders
- Show upcoming Calendar events or reminders separately, with details such as their names and times.
- Workouts or Activity rings by day
- Show separate workouts, or a day’s Activity rings in each entry.
Use a chart when you want to compare numbers as bars or a line. Use a list when you want to read each entry’s details.
Try it: steps for the last seven days#
Open a widget in Library and tap Design Visually. If you do not have one yet, start with a Gallery design or a blank widget. The widget preview you edit is called the canvas.
Open the List picker
With nothing selected, tap Add in the toolbar below the canvas. Open Group & List, then tap List.
Choose Steps, day by day
On What should the list show?, find the Health section and tap Steps, day by day. Scroll the picker if needed.
Choose the days and count
On Which ones?, choose Last 7 days. Under At most, tap 7 rows. This asks for up to seven entries; they still need room to fit.
Choose the starting design
Tap Next: pick a row style, choose Simple line, then tap Add list. If the app shows its first-time explanation, tap through Next and Got it.
Check the result
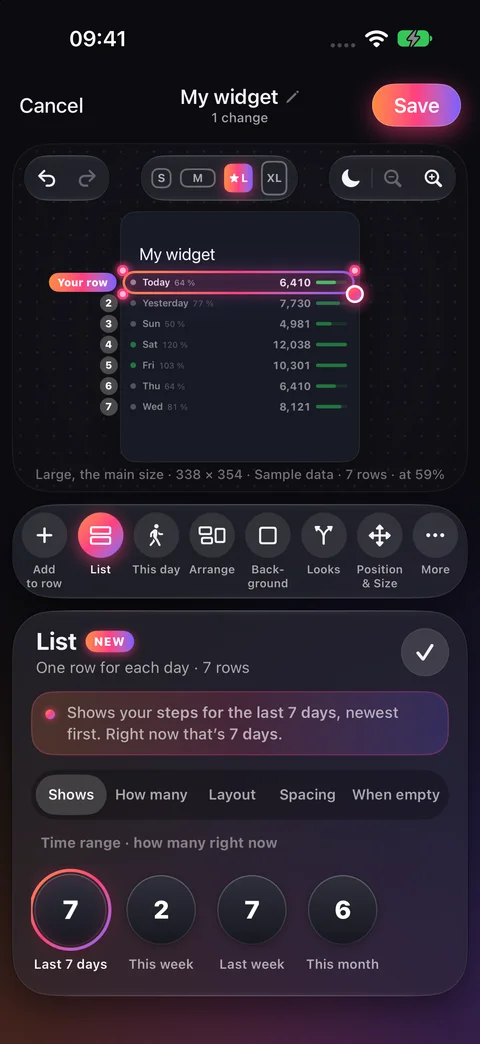
You should see day labels and step counts, with the first entry marked Your row. The other entries use the same design with their own day’s values. The starting style also includes a percentage and progress bar.
Use your data and save
Example values appear while Sample data is on. Turn it off and check Health access to use your own records. Tap Save at the top to keep the widget.
Change how every entry looks#
In the editor, the first entry is the one you design. Tap a number or word in that first entry, then open Text in the toolbar to change its font, size, or color. The same part changes in every entry. Making today’s step count bigger also makes yesterday’s step count bigger.
The app draws the other entries from that first design. Those are the copies. They are not separate designs you edit one at a time. Tapping a later entry selects Your row and explains that it is a copy.
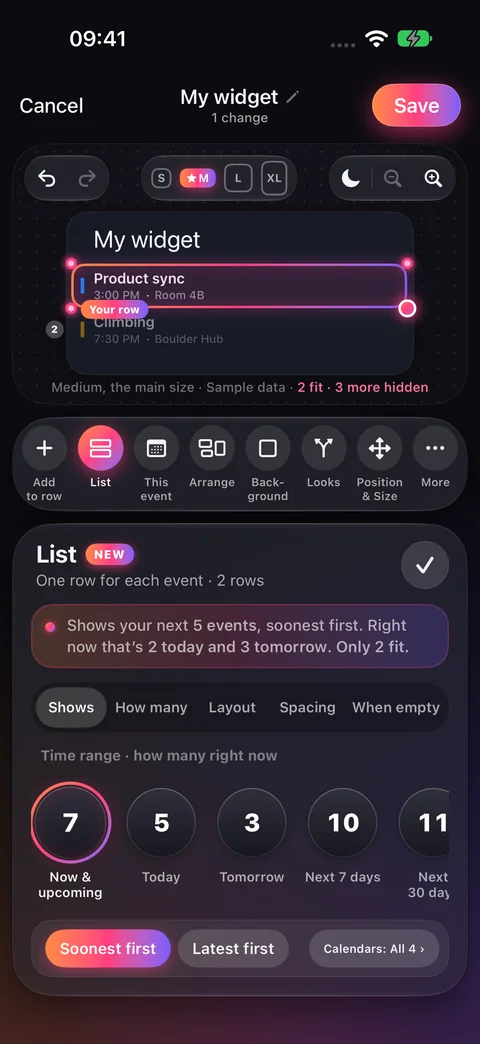
To open controls for the whole list, select the list in Layers, or tap a later entry. You should see List, This day, Arrange, and Add to row in the toolbar for the steps example. For an events list, the value tool is called This event instead.
Choose the details in each entry#
With the whole steps list selected, tap This day in the toolbar. It offers details for each day, such as Day, Weekday, Steps, and Steps, number. In a starting row style, a checkmark means that detail is already included. Tap an unchecked detail to add it; tap a checked one to remove it.
For example, Steps includes the unit (“6,410 steps”), while Steps, number is just the number (“6,410”). Each entry gets its own value. To change its appearance, tap that part in the first entry and open Text.
Use Add to row for something you want in every entry, such as a fixed icon or a label you type. A label reading “Steps” repeats as “Steps” everywhere. A number you type, such as “6,410”, also repeats unchanged. Use the This day values for a number that should differ between days.
The value tool’s name follows the list: This event, This reading, This hour, This day, and so on. An hourly forecast arranged side by side calls the first entry Your column. It works the same way.
Change the period or filter#
Select the whole list, tap List in the toolbar, then tap Shows near the top of its panel. Choose a time range. The choices depend on the kind of list: daily steps offers week and month ranges, while heart-rate readings offers choices such as Last 24 hours and Last hour.
Below the range, use the order and filter controls. Scroll inside the List panel if they are below the visible area.
- Daily Health values or readings
- Tap Measurement: … to choose what to measure. A day-by-day list and a readings list offer different measurements.
- Calendar events
- Tap Calendars: … to choose which calendars supply events.
- Reminders
- Tap Lists: … to choose the reminder lists.
- Workouts
- Tap Kinds: … to choose the workout types.
The sentence at the top of the List panel describes the current selection. Read it to check what your list is asking for.
Give the entries room#
Select the whole list and open List in the toolbar. These buttons are near the top of its panel:
- How many
- Tap List → How many to set the maximum number of entries. Tap Other… for the At most ruler, which offers 1–10. A seven-day range with a three-row maximum shows only up to three entries.
- Layout
- Tap List → Layout. Stacked puts entries underneath one another. Side by side puts them in columns, like an hourly forecast. Grid puts two entries on each line. Row height is also in this panel.
- Spacing
- Tap List → Spacing for the gaps between entries, a dividing line, or alternating backgrounds.
- Arrange
- Tap Arrange in the toolbar to position the parts inside each entry—for example, its label and number. This changes a different thing from List → Layout, which positions the entries themselves.
When there is nothing to show#
A reminders list can have no matching reminders, and a readings list can have no recorded measurements in its chosen period. You can choose the message the widget shows in that situation.
Open the empty controls
Select the list, tap List in the toolbar, then When empty.
Preview an empty list
Turn on Preview with no…. The ending follows the list—for example, “readings” or “events”. This only changes the preview; it does not delete data.
Edit the words
Beside Empty message, tap Edit, enter your message, and tap Done.
Return to the normal preview
Turn the empty preview switch off, then save your widget.
Why are some entries missing?#
First select the list and check List → Shows for the period and filters, then List → How many for the maximum. If only three readings exist in that period, asking for seven does not create another four.
If the canvas says something like “6 fit · 1 more hidden”, the list has more entries than its box can hold. Under List → How many, use Smaller rows when offered. Or open List → Layout. Under Row height, choose Your own and drag the Height ruler to make each entry shorter.
To give the whole list more room, select it and open Position & Size → Size → List height. You can also try a larger widget size using the controls above the canvas. Adding extra details can make each entry taller, so check how many still fit afterward.
If the list has no real values, check Sample data, access, and the source app. A Health reading must already be recorded; a forecast needs location access.
Checked against the app · October 6, 2026.
Screenshots use example data or the app’s test image.