
Browse all guides
ADD TO YOUR WIDGET
Charts
See how your numbers change.
In this guide
See a pattern instead of just one number#
Today’s step count tells you about today. A chart can put several days beside one another so you can see the busy days and quiet days. A weather chart can show how the forecast temperature changes through the upcoming hours.
- Bar chart
- Compare separate values using bars. A taller bar represents a larger value; daily step counts are one example.
- Line chart
- Follow values across time. The rise and fall of the line helps you see a pattern, such as a temperature forecast.
- Pie or ring chart
- Show values as slices of a whole. Larger values take larger slices.
- My numbers
- Enter labels and numbers yourself instead of reading them from a connected source.
Open your saved widget in Library, then tap Design Visually. Once a chart is added and selected, its toolbar has Chart, Data, Style, and Axes & Labels. Start with Data: it decides what the picture represents.
To find Add, tap the empty canvas outside the widget preview to leave any selection. Add appears in the toolbar below the preview. Once you add a piece, select it to open its own tools.
Add a chart#
Choose a chart tile
Open Add → Charts. Tap Bar, Line, Pie & Ring, or My numbers.
Pick a starting style
Try a style in the chart picker, then tap Add chart.
Choose its data
Select the chart and open Data. Choose the source, measurement, and time range it offers.
Choose the kind of picture#
Select the chart on the canvas, tap Chart in the toolbar, then use the buttons inside that panel:
- Type
- Open Chart → Type to choose a kind and its variants, such as lines, areas, bars, pies, or rings. The variants depend on the kind.
- Highlight
- Open Chart → Highlight to emphasize particular values. Line charts can show a point at each value.
- Goal line
- For a line or bar chart, open Chart → Goal line. A goal line marks a target across the picture, so you can see which values reach it.
- Middle
- For a pie or ring, open Chart → Middle to choose what appears in the center.
Choose what the chart measures#
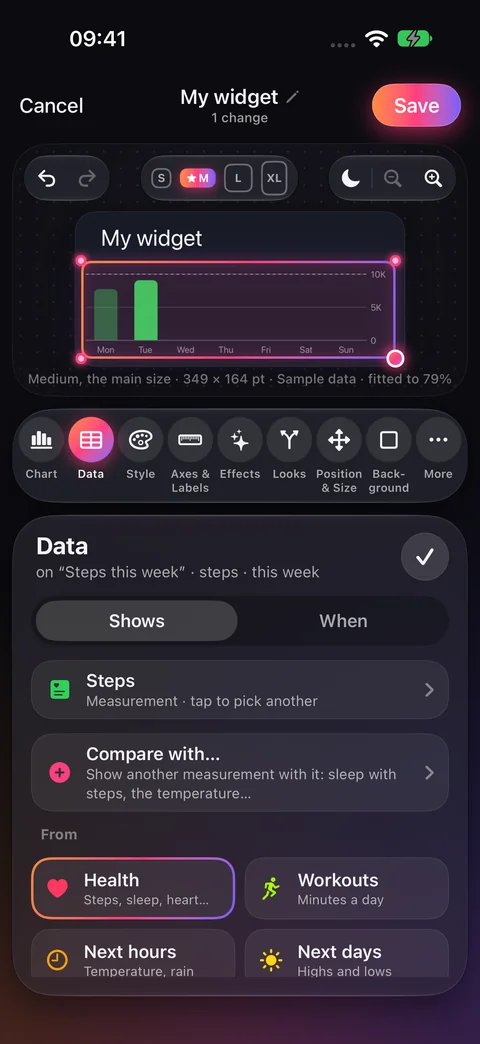
Select the chart, tap Data in the toolbar, then tap Shows in the panel. Choose its source—the place its numbers come from. Supported choices include Health, workouts, forecast hours or days, events, reminders, and your own numbers.
For a daily steps chart, choose the Health source and Steps as its measurement. Open Data → When to choose the period it offers. Now the picture represents steps over that period, rather than an unrelated set of numbers.
Where supported, the Data panel offers comparison with the previous period or Compare with… to add another measurement. A comparison adds another set of values to the picture; it does not replace your source records.
Type your own numbers#
Start with My numbers, or choose the own-numbers source in Data. Edit the labels and values in the table. The chart uses those entries; it does not need permission to read an external source.
The chart’s Edit your numbers button opens the same controls.
Change its colors and shapes#
Select the chart and tap Style in the toolbar. Inside this panel, Colors offers palettes and custom colors. The other button depends on the chart: Line changes line width and curve, Bars changes bar width and ends, and Slices changes the pie or ring’s hole and thickness.
Style changes how the same numbers are drawn. To choose different numbers or a different period, use Data instead.
Make the chart readable#
Select the chart, then tap Axes & Labels in the toolbar. The buttons inside that panel control the words and numbers around the picture:
- Axes
- The axes are the labeled edges: one tells you the day, hour, or category, and the other gives the number scale. Use Axes & Labels → Axes to show or hide those labels and the grid lines. Pies do not have axes.
- Values or Labels
- Use this part to write values on the chart itself. Line and bar charts can include units, such as “steps”, beside numbers.
- Scale
- Open Axes & Labels → Scale to adjust its lowest and highest displayed numbers. A line chart can start at zero or fit closely around its values. This changes the picture’s scale, not the values.
- Legend
- A legend tells you which color means which measurement or slice. Open Axes & Labels → Legend to choose how these names appear.
- Numbers
- Open Axes & Labels → Numbers for short numbers, such as “8.4K”, and decimal places.
Checked against the app · October 6, 2026.
Screenshots use example data or the app’s test image.